Connect with us

Weather where you are

Choose your location or share it once. We round your coordinates to about 1 km before sending them to our site and MET Norway for your forecast. Your choice stays in this browser tab.

Stay close to Boston

Get new Boston stories and Boston Made company updates, delivered as browser notifications.

Choose Enable notifications, then allow notifications in your browser.

Your browser subscription is stored by Boston Made and delivered through your browser’s push service. You can turn notifications off in your browser’s site settings. Privacy policy

Real Estate & Development

Boston Housing Market Holds Firm at the Midpoint of 2026

Published

on

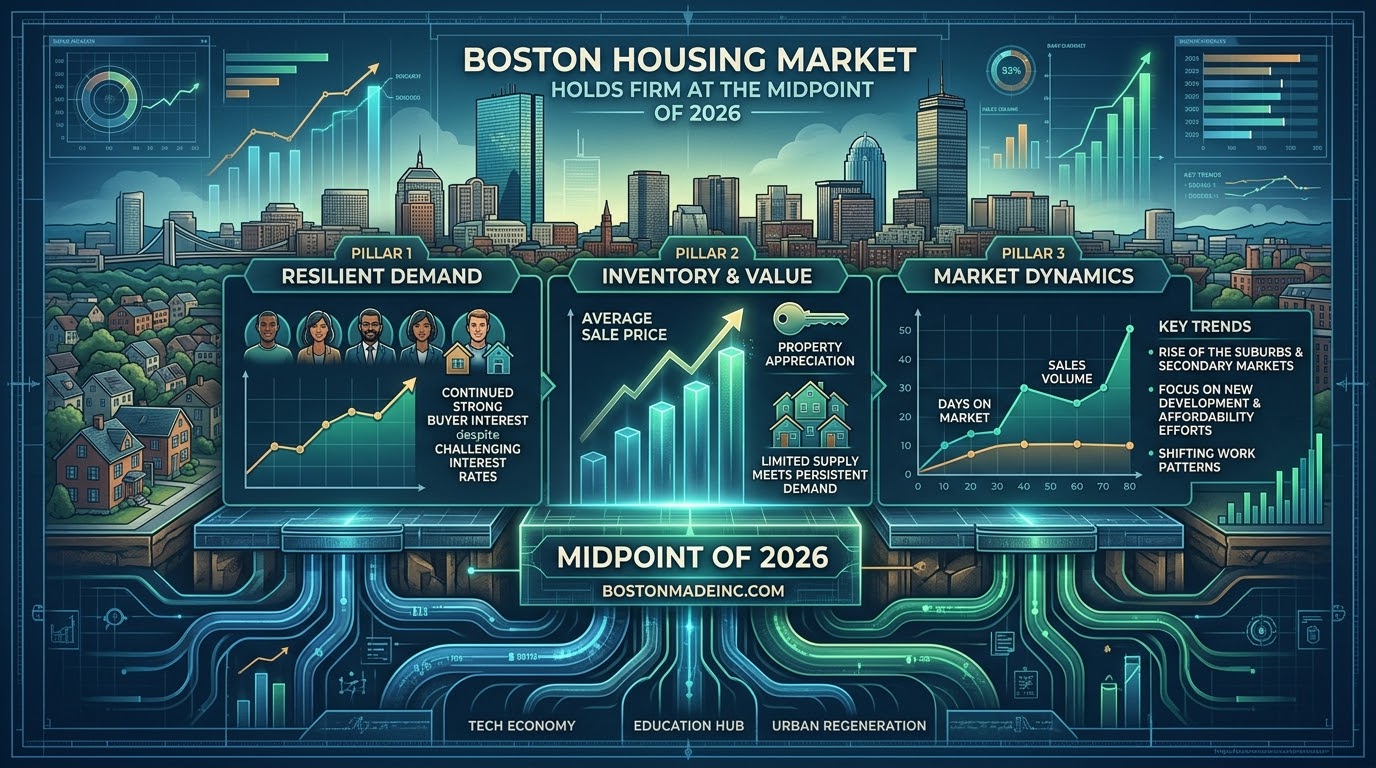
Illustration for “Boston Housing Market Holds Firm at the Midpoint of 2026”

Boston’s housing market has remained a focal point for the region’s economy through the middle of 2026, with real estate trackers including Redfin, Zillow, and locally based brokerages publishing mid-year assessments of the city’s home-price trends. While the specific figures vary by source and methodology, the broader picture described across multiple mid-2026 market reports is one of a housing market that has stayed comparatively resilient even as affordability remains a persistent concern for buyers.

Boston’s housing costs have long outpaced national medians, driven by constrained inventory, high demand tied to the region’s university and hospital systems, and a limited pipeline of new construction relative to demand — dynamics that multiple 2026 market analyses point to as continuing to define the city’s real estate landscape. Local brokerages tracking the market, including Centre Realty Group’s mid-year report, have characterized 2026 as a year of relative stability in prices even as transaction volume and buyer behavior have shifted with financing costs.

Advertisement

The Boston market’s trajectory carries outsized importance for the wider Massachusetts economy. Real estate and related construction, financing, and development activity make up a substantial share of economic activity in Greater Boston, and shifts in the housing market ripple into everything from municipal tax revenue to household spending power.

Developers and city planners have continued to focus on housing production as a core policy issue, with state and local officials pointing to new housing supply as a key lever for addressing affordability pressures that have built over multiple years. Whether new development can meaningfully expand supply fast enough to ease price pressure remains one of the central questions facing Boston’s real estate market through the rest of 2026 and into 2027.

For prospective buyers, sellers, and developers, the range of mid-year 2026 housing reports point to a market that, while not booming, has avoided a sharp downturn — a dynamic that real estate professionals in the region describe as a market finding a new equilibrium after several turbulent years shaped by shifting mortgage rates.


Sources:

Background

Housing prices in Greater Boston reflect a long-standing mismatch between demand and supply. The region’s universities, hospitals, life sciences companies and financial firms draw a steady stream of workers and students. At the same time, much of the area is already built up, land is expensive, and local zoning rules in many communities limit the kinds of housing that can be constructed, especially multifamily buildings.

Advertisement

State policy has increasingly focused on supply. The MBTA Communities law, enacted in 2021, requires cities and towns served by the MBTA to have at least one zoning district near transit where multifamily housing is allowed by right. Communities have taken varied approaches to complying, and the effects on actual construction take time to appear, since building housing involves financing, permitting and construction that can stretch over several years.

Why different reports show different numbers

The original article notes that figures vary by source and methodology. That is common in housing data:

  • Median sale price reflects the homes that sold in a period, which can shift if the mix of homes changes.
  • Home value indexes estimate the value of all homes, including those that did not sell.
  • Geography matters: “Boston” can mean the city, the metro area or a broader region.
  • Timing matters: some reports use closed sales, others use listings or pending sales.

Comparing figures from the same source over time is generally more reliable than comparing different sources with each other.

What it means for Boston-area readers

For buyers, a stable market can mean less pressure to rush, but affordability remains the main challenge. Financing costs, property taxes, insurance and condominium fees all affect the monthly cost of owning. For sellers, stable prices may mean pricing realistically matters more than in a fast-rising market. For renters, the supply questions that affect home prices also affect rents.

  • Get preapproved before shopping, so budgets are based on real numbers.
  • Look at the total monthly cost, not just the purchase price.
  • Check local zoning and development plans for areas of interest.
  • Consult a licensed real estate professional and a lender for decisions specific to your situation.

Key terms

  • Inventory: the number of homes listed for sale at a given time.
  • Months of supply: how long it would take to sell current inventory at the current pace of sales.
  • Median price: the middle price of homes sold, with half selling for more and half for less.
  • By right: allowed under zoning without a special permit or discretionary approval.
  • Equilibrium: a state where supply and demand are roughly balanced.

What to watch

  • Changes in inventory and months of supply in upcoming reports.
  • Mortgage rate trends and their effect on buyer activity.
  • Housing permits and construction starts across the region.
  • Progress on local zoning changes tied to state housing policy.
  • Differences in trends between the city and surrounding suburbs.
  • Trends in condominiums compared with single-family homes, which often move differently.

Mid-year reports offer a snapshot, and seasonal patterns can affect what they show, since spring and early summer are traditionally busy months for home sales in New England. Reading year-end reports alongside mid-year figures, and comparing the same months across years, helps separate seasonal swings from longer-term changes in the market. Local conditions can also differ sharply from one neighborhood or suburb to the next, so citywide figures are only a starting point for any individual decision.

Quick check: According to the article, what has been described as a key lever for addressing Boston’s affordability pressures?

  1. New housing supply
  2. Higher property taxes
  3. Fewer universities
Show answer

A. State and local officials point to new housing supply as a key lever for addressing affordability.

Continue Reading

Economy

Massachusetts Housing Awards Include New Homes and Preservation Projects in Boston

A $278 million statewide financing round supports housing development, including construction and preservation projects across Boston.

Published

on

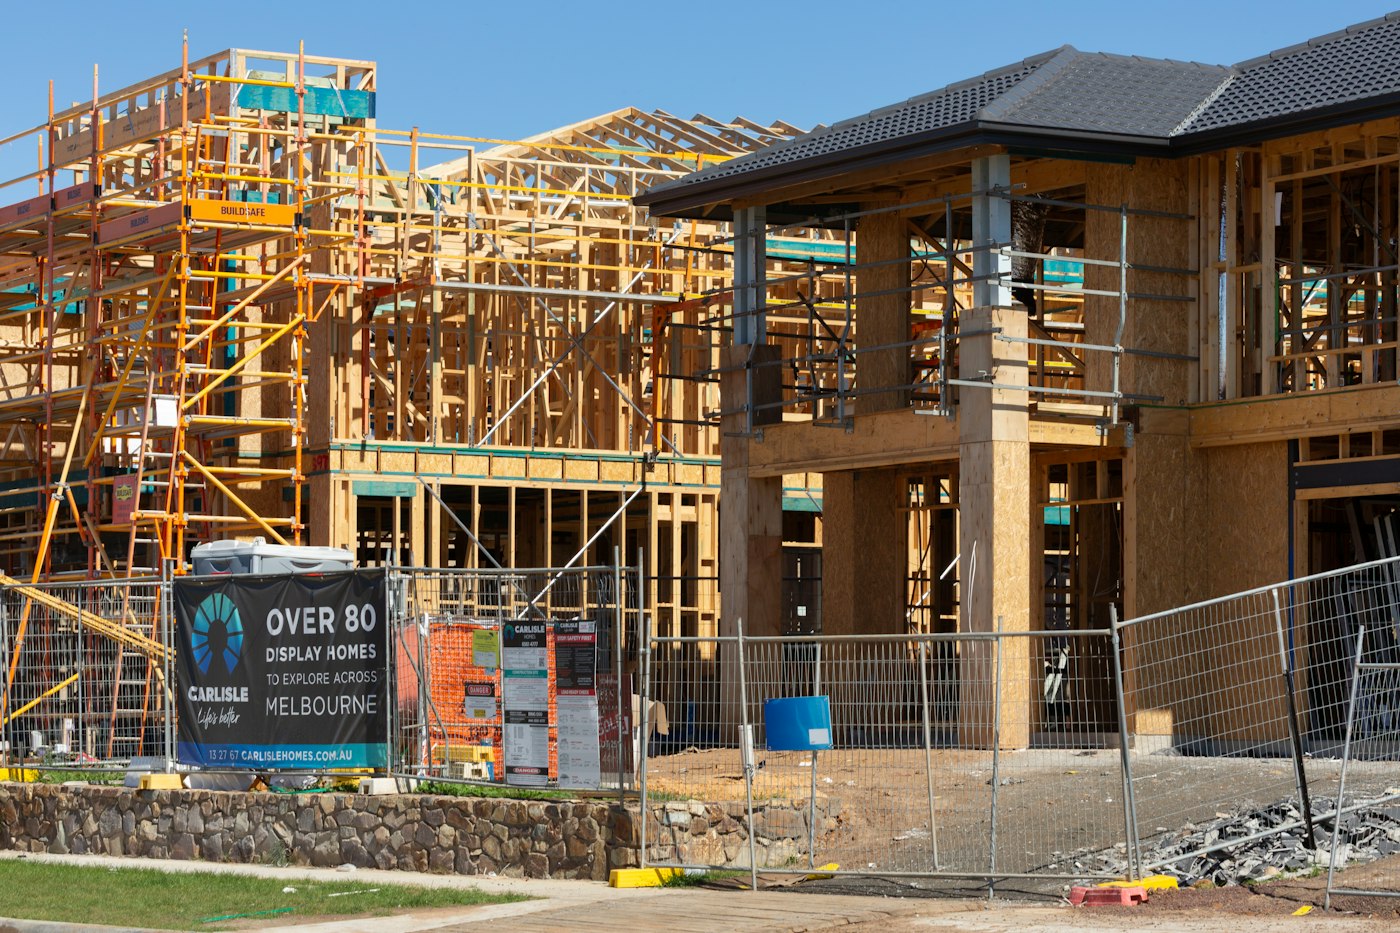
New houses under construction with wooden framing

Massachusetts announced $278 million in state and federal financing and tax credits on September 3 for housing developments across 20 communities. The package includes both new construction and preservation work.

Boston projects in the round

The state’s award list includes 65 senior homes at Fox Hall in South Boston, 35 family homes at 80 Shawsheen Road in East Boston, and 78 senior homes at 1198 Centre in Roslindale.

Advertisement

Advertisement

Other Boston awards support preservation of 331 homes at Orchard Gardens, rehabilitation of seven homes on St. Alphonsus Street, and construction of 72 family homes at 150 Centre Street.

Funding is one step toward delivery

These are development awards, rather than an announcement that the homes are ready for occupancy. Readers seeking housing should follow individual project announcements for construction progress and application information.

Source: Massachusetts Executive Office of Housing and Livable Communities announcement, September 3, 2026; reviewed September 8.

Background

Building or preserving affordable housing usually requires several layers of financing. Construction costs, land and long-term operating expenses are often too high to be covered by the rents that lower-income households can afford, so developers combine private loans with public funding and tax credits to make projects work. A single development may draw on federal, state and local sources, each with its own rules.

Advertisement

One of the most widely used tools is the federal Low-Income Housing Tax Credit. States allocate these credits to selected projects, and developers typically sell them to investors in exchange for upfront equity that helps pay for construction or rehabilitation. In return, the property must keep units affordable to qualifying households for a long period. States may also offer their own housing tax credits and loan programs, which can work alongside the federal credit.

Funding rounds like the one described in the article are common in housing finance. Agencies accept applications, evaluate them against published criteria and announce awards in batches. Receiving an award is an important milestone, but projects still need to complete other steps, such as closing on financing, finalizing permits and completing construction or renovation.

New construction versus preservation

Housing programs generally support two broad kinds of work:

Advertisement

  • New construction adds homes that did not exist before, which increases the overall housing supply.
  • Preservation keeps existing affordable homes available and in good condition, often by renovating aging buildings or extending affordability requirements that might otherwise expire.

Both matter. New construction expands supply, while preservation helps prevent the loss of affordable homes that already exist and helps current residents stay in their communities. Rehabilitation, a form of preservation, can involve repairing systems, improving energy efficiency and upgrading accessibility.

Why delivery takes time

Affordable housing developments often move through a long sequence of steps. Before construction can begin, a developer typically needs site control, zoning and permit approvals, design work, a complete financing package and agreements with each funding source. Once funding is assembled, the deal must close, and only then does construction or renovation usually start. Construction itself can take a year or more for a mid-sized building, depending on its size and complexity. Delays can come from permitting, rising costs, supply issues or changes to the financing. For these reasons, the time between an award announcement and move-in day is often measured in years rather than months, and timelines for individual projects can differ widely.

What it means for Boston-area readers

For residents looking for affordable housing, it helps to understand how these homes typically become available:

  • Applications usually open closer to completion. For new developments, marketing and applications generally begin once a project nears the end of construction, not when funding is announced.
  • Many units use lotteries or waitlists. Because demand is high, affordable units are often filled through lotteries or waitlists with eligibility rules.
  • Income limits apply. Eligibility is usually tied to household income relative to the area median income, and limits vary by household size.
  • Some homes are age-restricted. Senior housing developments set age requirements according to their program rules.
  • Preservation projects may not open new units. In many cases, they protect homes for current residents rather than creating vacancies.
  • Use official sources. Rely on information from the developer, the property’s management company or government housing offices, and be cautious of anyone asking for payment to secure a spot.

For residents who live near a funded development, community meetings and local permitting hearings are common opportunities to learn about plans and timelines.

Key terms

  • Low-Income Housing Tax Credit (LIHTC): A federal tax credit used to finance affordable rental housing, allocated by states.
  • Area median income (AMI): The midpoint household income for a region, used to set eligibility limits.
  • Preservation: Keeping existing affordable housing available and in good condition.
  • Rehabilitation: Renovating an existing building to repair or upgrade it.
  • Housing lottery: A random selection process used to choose applicants for affordable units when demand exceeds supply.
  • Affordability restriction: A legal requirement that units remain affordable to qualifying households for a set period.

What to watch

  • Announcements from individual projects about construction starts and progress.
  • Notices of application periods and lottery information for completed developments.
  • Future state funding rounds and the criteria used to select projects.
  • Local permitting and community meetings for developments in your neighborhood.
  • Updates on preservation projects and any temporary arrangements for current residents during renovations.

Quick check: When do applications for new affordable homes typically open?

  1. The day funding is announced
  2. As a project nears completion of construction
  3. Only after residents have moved in
Show answer

B. Funding is one step toward delivery; marketing and applications generally begin as a development nears completion.

Lumo Kingswell Lumo Precious-metals education and a two-sided gold exchange with a live gold price. Visit site →

Advertisement

Continue Reading

Economy

Renting vs. Buying in Boston: The 2026 Math Favors Renters by $1,300 a Month

Boston 2-bedroom rents averaged $2,800 in early 2026, up 3.7% year-over-year, while the monthly cost of owning now runs about $1,362 higher than renting a 3-bedroom.

Published

on

Golden-hour aerial view of South End brownstones and a Gothic cathedral

For anyone weighing whether to rent or buy in Boston right now, the numbers tell a clear story: renting is the cheaper option, and the gap is widening.

Rents keep climbing across every unit size

According to Rental Beast’s first-quarter 2026 data, median rents in Boston rose across the board:

Advertisement

Advertisement
  • One-bedroom: $2,445, up 2.2% year-over-year
  • Two-bedroom: $2,800, up 3.7%
  • Three-bedroom: $3,421, up 2.9%
  • Single-family homes: $2,995, up 3.3%
  • Multi-family units: $2,670, up 2.7%

At the same time, landlords are pulling back on concessions. The concession rate sits at 25.8% in Boston, well below the 41.8% national average, and units are leasing in about 28 days — a sign that tenant demand remains firm even as rents rise.

Ownership costs pull further ahead

The bigger story may be on the ownership side. The report pegs the average monthly cost of homeownership in Boston at $4,782, compared with $3,421 to rent a comparable three-bedroom — a gap of roughly $1,362 per month, or more than $16,000 a year. That makes Boston one of the markets with the widest rent-versus-own premiums the firm tracks.

What it means for Boston households

With property managers expecting rents to keep climbing and mortgage costs still elevated, the rent-versus-buy decision is getting starker rather than more balanced. For many households, that math is reinforcing renting as the default, at least until financing costs ease or housing supply meaningfully expands.

Background

The rent-or-buy question has no single right answer, because it depends on how long someone plans to stay, how much they can put down, their other financial goals and local market conditions. Monthly cost comparisons are a useful starting point, but they capture only part of the picture.

Advertisement

Owning a home involves costs that renters usually do not pay directly: property taxes, homeowners insurance, maintenance and repairs, and, for condominiums, association fees. Owners also tie up money in a down payment and closing costs, money that could otherwise be saved or invested. On the other hand, owners build equity as they pay down the mortgage, may benefit if the home’s value rises and gain stability in housing costs if they have a fixed-rate loan. Renters pay a landlord who covers many of those ownership costs, but rents can rise when leases renew.

Analysts sometimes use the price-to-rent ratio, the price of a home divided by a year’s rent for a comparable home, as a rough gauge of whether a market leans toward renting or buying. A high ratio suggests buying is expensive relative to renting. Like any single measure, it simplifies a complicated decision, but it helps explain why some high-cost metro areas, Boston among them, often show wide gaps between the monthly cost of owning and renting.

Advertisement

It is also important to remember that a monthly comparison is a snapshot. Over many years, rents usually change, home values can rise or fall, and a fixed-rate mortgage payment stays the same while taxes and insurance may increase. Each of these moves the comparison in different directions over time.

How to think about the comparison

Several factors can shift the math for an individual household:

  • Time horizon: buying and selling a home involves significant transaction costs, so owning generally makes more sense the longer someone stays.
  • Down payment: a larger down payment reduces the loan amount and may eliminate mortgage insurance.
  • Interest rates: higher rates increase monthly payments for the same purchase price.
  • Tax considerations: mortgage interest and property taxes may be deductible for some taxpayers, depending on their situation.
  • Flexibility: renting makes it easier to move for a job or life change.
  • Maintenance: owners are responsible for repairs, which can be unpredictable.

What it means for Boston households

For Boston households, the practical step is to build a personal comparison rather than relying only on averages. That means estimating the full monthly cost of owning a specific type of home in a specific neighborhood, comparing it with current rent for a similar place, and considering how long the household expects to stay.

  • Get a mortgage preapproval to understand actual borrowing costs.
  • Ask for property tax and condo fee figures for homes you are considering.
  • Set aside a maintenance budget in any ownership estimate.
  • Read lease terms carefully, including renewal and increase provisions.
  • Look into first-time homebuyer programs that may offer assistance.
  • Talk with a housing counselor, lender or financial professional for personalized guidance.

Renters who choose to keep renting can still build toward future goals. Setting aside savings regularly, keeping credit in good standing and tracking local market conditions can make a later purchase more manageable if circumstances change.

Key terms

  • Median rent: the middle rent in a set of listings or leases, with half higher and half lower.
  • Concession: an incentive offered by landlords, such as a free month of rent.
  • Days on market: how long a rental or home takes to lease or sell.
  • Equity: the portion of a home’s value the owner owns outright.
  • Down payment: the upfront portion of the purchase price paid in cash.
  • Mortgage insurance: insurance lenders often require when the down payment is below a certain level.
  • Closing costs: fees and expenses paid when a home purchase is finalized.

What to watch

  • Upcoming quarterly rent reports for changes in median rents and concessions.
  • Mortgage rate trends, which affect the ownership side of the comparison.
  • New housing supply coming online in Boston and nearby communities.
  • Changes in property taxes and insurance costs.
  • Days on market for rentals as a signal of demand.

Quick check: What is the average monthly cost of homeownership in Boston, according to the report cited?

  1. $2,445
  2. $3,421
  3. $4,782
Show answer

C. The report pegs the average monthly cost of homeownership at $4,782, compared with $3,421 to rent a three-bedroom.

Boston Made UK Boston Made family Boston Made UK Boston Made across the Atlantic. Visit site →

Advertisement

Continue Reading

Economy

Boston Housing Market Holds Near-Record Highs Even as Rates Bite

Boston’s median home price hit $849,575 in July, up 2.4% year-over-year, as homes keep selling fast and above asking in one of the nation’s most competitive markets.

Published

on

Boston Housing Market Holds Near Record Highs Even as Rates Bite

Boston’s housing market is still running hot. The median sale price in the city reached $849,575 in July 2026, up 2.4% from a year earlier, according to Redfin data — and buyers are still fighting for what little inventory hits the market.

Homes are moving fast, and going for close to asking

The typical Boston home spent just 23 days on the market in July, one day longer than the same month last year, but still fast by national standards. Redfin rates Boston a 76 out of 100 on its Compete Score, calling the market “very competitive.” Nearly 35% of homes sold above their list price, and the median sale-to-list ratio landed at 99.9% — in plain terms, sellers are getting almost exactly what they’re asking for, and often more.

Advertisement

Advertisement

Over the three months ending in July, 1,668 homes changed hands in the city, a 3.4% increase in sales volume from the year before. That’s a signal that demand hasn’t cooled even as mortgage rates remain elevated compared to the pre-2022 era.

Why this matters for the region’s economy

Housing costs are the single biggest driver of Boston’s affordability conversation, and they ripple through everything from hiring to migration patterns. When homes keep appreciating and bidding wars remain the norm, it becomes harder for the workforce that keeps hospitals, labs, and startups running to actually live near their jobs — a dynamic that shows up later in labor force and population data across Massachusetts.

What to watch next

Inventory remains the key variable. As long as new listings stay scarce relative to demand, competitive bidding and fast sale timelines are likely to persist into the fall market. Boston Made’s Economy desk will keep tracking monthly sale-price and inventory data as it’s released.

Background

Housing market reports rely on a handful of common measures. The median sale price is the midpoint of all homes sold in a period, so half sold for more and half for less. It can be influenced by the mix of homes that happen to sell, such as more condos one month and more single-family homes another. Days on market measures how long homes take to go under contract or sell. The sale-to-list ratio compares the final sale price with the asking price, showing whether buyers are paying above or below what sellers asked.

Advertisement

Different data providers calculate these figures in slightly different ways and may define geographic areas differently, so numbers from one source may not match another exactly. Some measures are proprietary. Redfin’s Compete Score, for example, is the company’s own rating of how competitive a market is, based on its data.

Inventory, the number of homes available for sale, is a key factor in any housing market. When inventory is low relative to the number of buyers, homes tend to sell quickly and often at or above asking prices. When inventory rises, buyers typically have more choice and more room to negotiate. Analysts often describe inventory in terms of months of supply, meaning how long it would take to sell all listed homes at the current pace.

What it means for Boston-area readers

For people in Greater Boston, housing conditions affect buyers, sellers and renters differently:

  • Buyers may benefit from getting preapproved for a mortgage before shopping, understanding their budget including taxes and insurance, and knowing which contingencies, such as inspections, they want to keep.
  • Sellers often find that preparing a home well and pricing it realistically matter, even in a competitive market.
  • Renters are affected indirectly, because high purchase prices can keep more people renting, which can influence demand for rental housing.
  • Employers may notice housing costs in recruiting and retention, since workers weigh commuting time and living costs when considering jobs.

Anyone making a major housing decision may benefit from talking with a qualified real estate professional, mortgage lender or financial advisor about their specific situation.

How mortgage rates fit in

Mortgage rates influence how much buyers can afford, because a higher rate means a larger monthly payment for the same loan amount. Rates also affect current homeowners. Many owners who locked in lower rates in earlier years may be reluctant to sell and take on a new loan at a higher rate, which can reduce the number of homes listed for sale.

Key terms

  • Median sale price: The midpoint price of homes sold in a given period.
  • Days on market: The time a home is listed before it goes under contract or sells.
  • Sale-to-list ratio: The final sale price divided by the list price.
  • Inventory: The number of homes currently for sale.
  • Months of supply: How long it would take to sell current inventory at the recent sales pace.
  • Preapproval: A lender’s conditional commitment to lend up to a certain amount, based on a review of the buyer’s finances.

What to watch

  • Monthly inventory and new listing counts for Boston and surrounding communities.
  • Median sale prices over several months, rather than a single month.
  • Mortgage rate trends reported by lenders and housing finance agencies.
  • The share of homes selling above list price.
  • Seasonal patterns, since activity often shifts between spring, summer and fall.

Quick check: What does a sale-to-list ratio of about 100 percent indicate?

  1. Homes are selling for roughly their asking price
  2. Homes are selling for half the asking price
  3. No homes are selling
Show answer

A. The ratio compares the sale price with the list price, so about 100 percent means sellers are getting close to what they asked.

Boston Made Reader Boston Made family Boston Made Reader Free e-reader app for long reads, wires and books. Visit site →

Advertisement

Continue Reading
Advertisement

Advertisement

Ad

Advertisement

Trending

--:--·---·--°